Photography is an art that requires creativity and technical understanding. One of the important technical tools in photography is what is a histogram. In this article, we will explore the concept of what a histogram is in photography and reveal why a good understanding of histograms can produce better photos.
What is a Histogram?
Histograms are one of the important things in the world of photography that are often used by photographers to measure and understand the brightness level in an image. This concept is actually not only relevant in photography, but is also found in various other scientific disciplines. In the context of photography, a histogram serves as a graph that shows the degree of brightness of various pixels in your image.
To understand what a histogram is, imagine your image is divided into various small parts called pixels. Each pixel has a different level of brightness, ranging from very dark (shadows) to very bright (highlights). A histogram records the number of pixels that have a certain brightness level and depicts it in the form of a vertical bar graph.
Histograms are usually presented on two axes. The horizontal axis shows the brightness level, with shadows on the left and highlights on the right. The vertical axis shows the number of pixels at a given brightness level. When you look at the histogram, you can see how many pixels there are at various brightness levels.
Simply put, if your histogram has peaks on the right, it indicates that your image has a lot of highlights, whereas if the peaks are on the left, the image has a lot of shadows. An even histogram shows a balanced distribution of shadows, middle, and highlights.
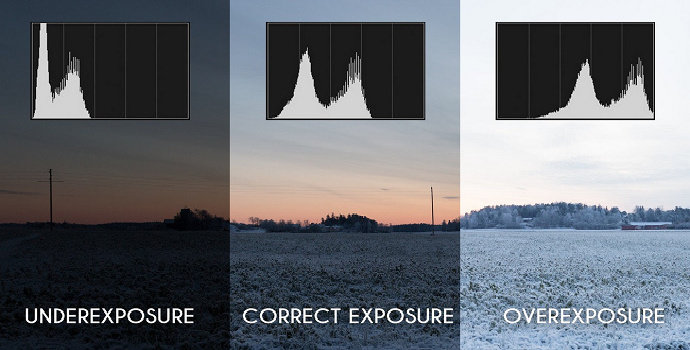
By understanding what a histogram is, you can make better decisions when shooting. You can see whether your images are suffering from overexposure (too bright) or underexposure (too dark), so you can make adjustments to your camera settings in real-time.
This allows you to get better photos overall, with better detail in shadows and highlights, creating a stunning final result. In other words what is a histogram, a histogram is a tool that allows you to measure and control lighting in photography, which is a key aspect in producing great images.
Parts of a Histogram
To truly understand and master what a histogram is, it is important for us to understand each component that forms part of this graph. Let's discuss the section in more detail:
1. Brightness Histogram
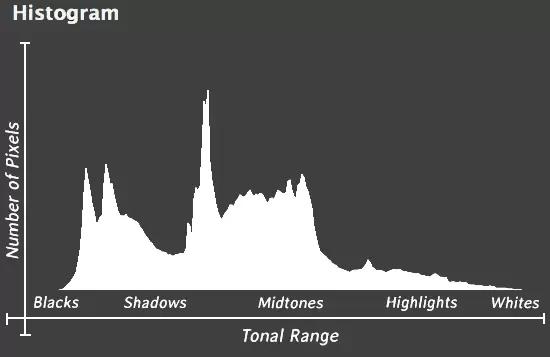
Brightness histogram is the histogram most commonly used in photography. It describes the distribution of brightness values in an image, ranging from very dark areas on the left to very bright areas on the right. The peaks in this histogram indicate the areas with the highest brightness in the image.
- Shadows: The dark parts to the left of the histogram represent areas of low brightness, such as shadows in an image. If the peak histogram is too close to the shadow areas, your image may be too dark and lose detail in the dark areas.
- Peak Height (Peak Height): The peak height in the histogram indicates how many pixels have a particular brightness value. A high peak in the middle of the histogram indicates that the image has many pixels with average brightness.
- Highlights: The bright parts to the right of the histogram represent areas of high brightness, such as highlights in an image. If the peak histogram is too close to the highlights, your image may be too bright and lose detail in the highlights.
2. Color Histogram (RGB Histogram)
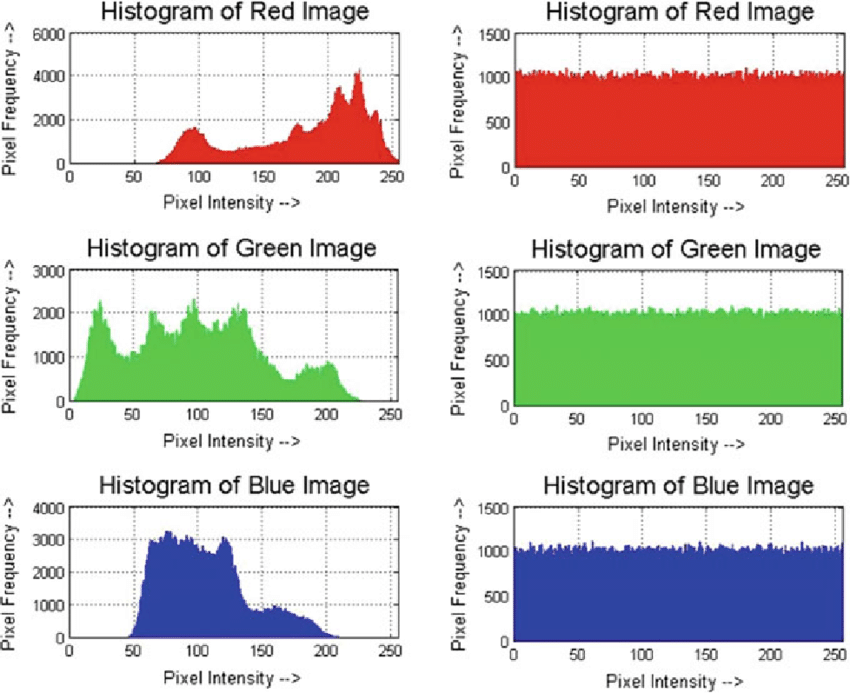
In addition to brightness histograms, in digital photography, color histogram is also very important. The color histogram consists of three main components: red (R), green (G), and blue (B), which reflect how these three primary colors are distributed in the image. Color histograms can help you understand the color balance in an image.
- Red: The red histogram shows the distribution of red colors in the image. High peaks in the red part indicate that there are many red pixels in the image.
- Green: The green histogram reflects the distribution of green color in the image. High peaks in the green section indicate that there are many green pixels in the image.
- Blue: The blue histogram depicts the distribution of blue colors in an image. High peaks in the blue region indicate that there are many blue pixels in the image.
By understanding color histograms, you can control color balance and avoid overly saturated or overly pale colors in your images.
Why is Histogram Important in Photography?
Histograms are one of the most important tools in photography, and a good understanding of them can make a significant difference in the quality of your final photo. Let's see what histograms are so important in the world of photography.
1. Ensure Proper Lighting
One of the main reasons why histograms are so important is to ensure proper lighting in your images. In photography, inappropriate lighting can produce photos that are blurry or too dark. By looking at the histogram, you can see how evenly distributed the brightness levels are in your image. If the histogram tends towards the right side (highlights), it could be an indication of overexposure, whereas if it tends towards the left side (shadows), it could indicate underexposure. With this information, you can adjust your camera settings in real-time to get the perfect lighting.
2. Analyze Image Details
Histograms help you analyze the extent of detail in your image. For example, in landscape photography, you may want to make sure that you have enough detail in the shadows as well as in the bright sky. By looking at the histogram, you can check whether your image has an even distribution between different brightness levels, or whether there may be areas that are losing detail.
3. Identifying Overexposure and Underexposure
The histogram also helps you identify whether your image is overexposed or underexposed. Overexposure occurs when important parts of an image, such as a bright sky or subject highlights, lose detail due to excessive light. On the other hand, underexposure produces shadows that are too dark, which can obscure details in important areas. By looking at the histogram, you can immediately see whether exposure adjustments or exposure compensation need to be made to avoid this problem.
4. Real-time Correction
The histogram also allows you to make real-time corrections while shooting. When you look at the histogram and see that your image tends to overexpose, you can reduce the exposure to avoid this. On the other hand, if you see underexposure, you can increase the exposure or use a flash to correct it.
5. Improved End Results
By using them effectively, histograms can help you produce better photos overall. You can maximize the information in your images by ensuring that the highlights and shadows have enough detail. The end result is more dynamic, high-quality and stunning photos.
6. Avoid Mistakes with Preview
The histogram also serves as an early warning of potential lighting problems while you are still in the field. This allows you to take corrective action before the photo is complete, which is much better than discovering lighting problems later when editing the image.
7. Consistency in Results
By using the histogram consistently, you can achieve consistency in your photos. This is important, especially if you are a professional photographer who wants to maintain a consistent brand and style in your portfolio.
Histogram Tools in Photography
Histograms are an important tool in the world of photography, and photographers have a variety of ways to access and use histograms when taking and editing photos. Let's discuss some of the main tools used to view and utilize histograms in a photography context:
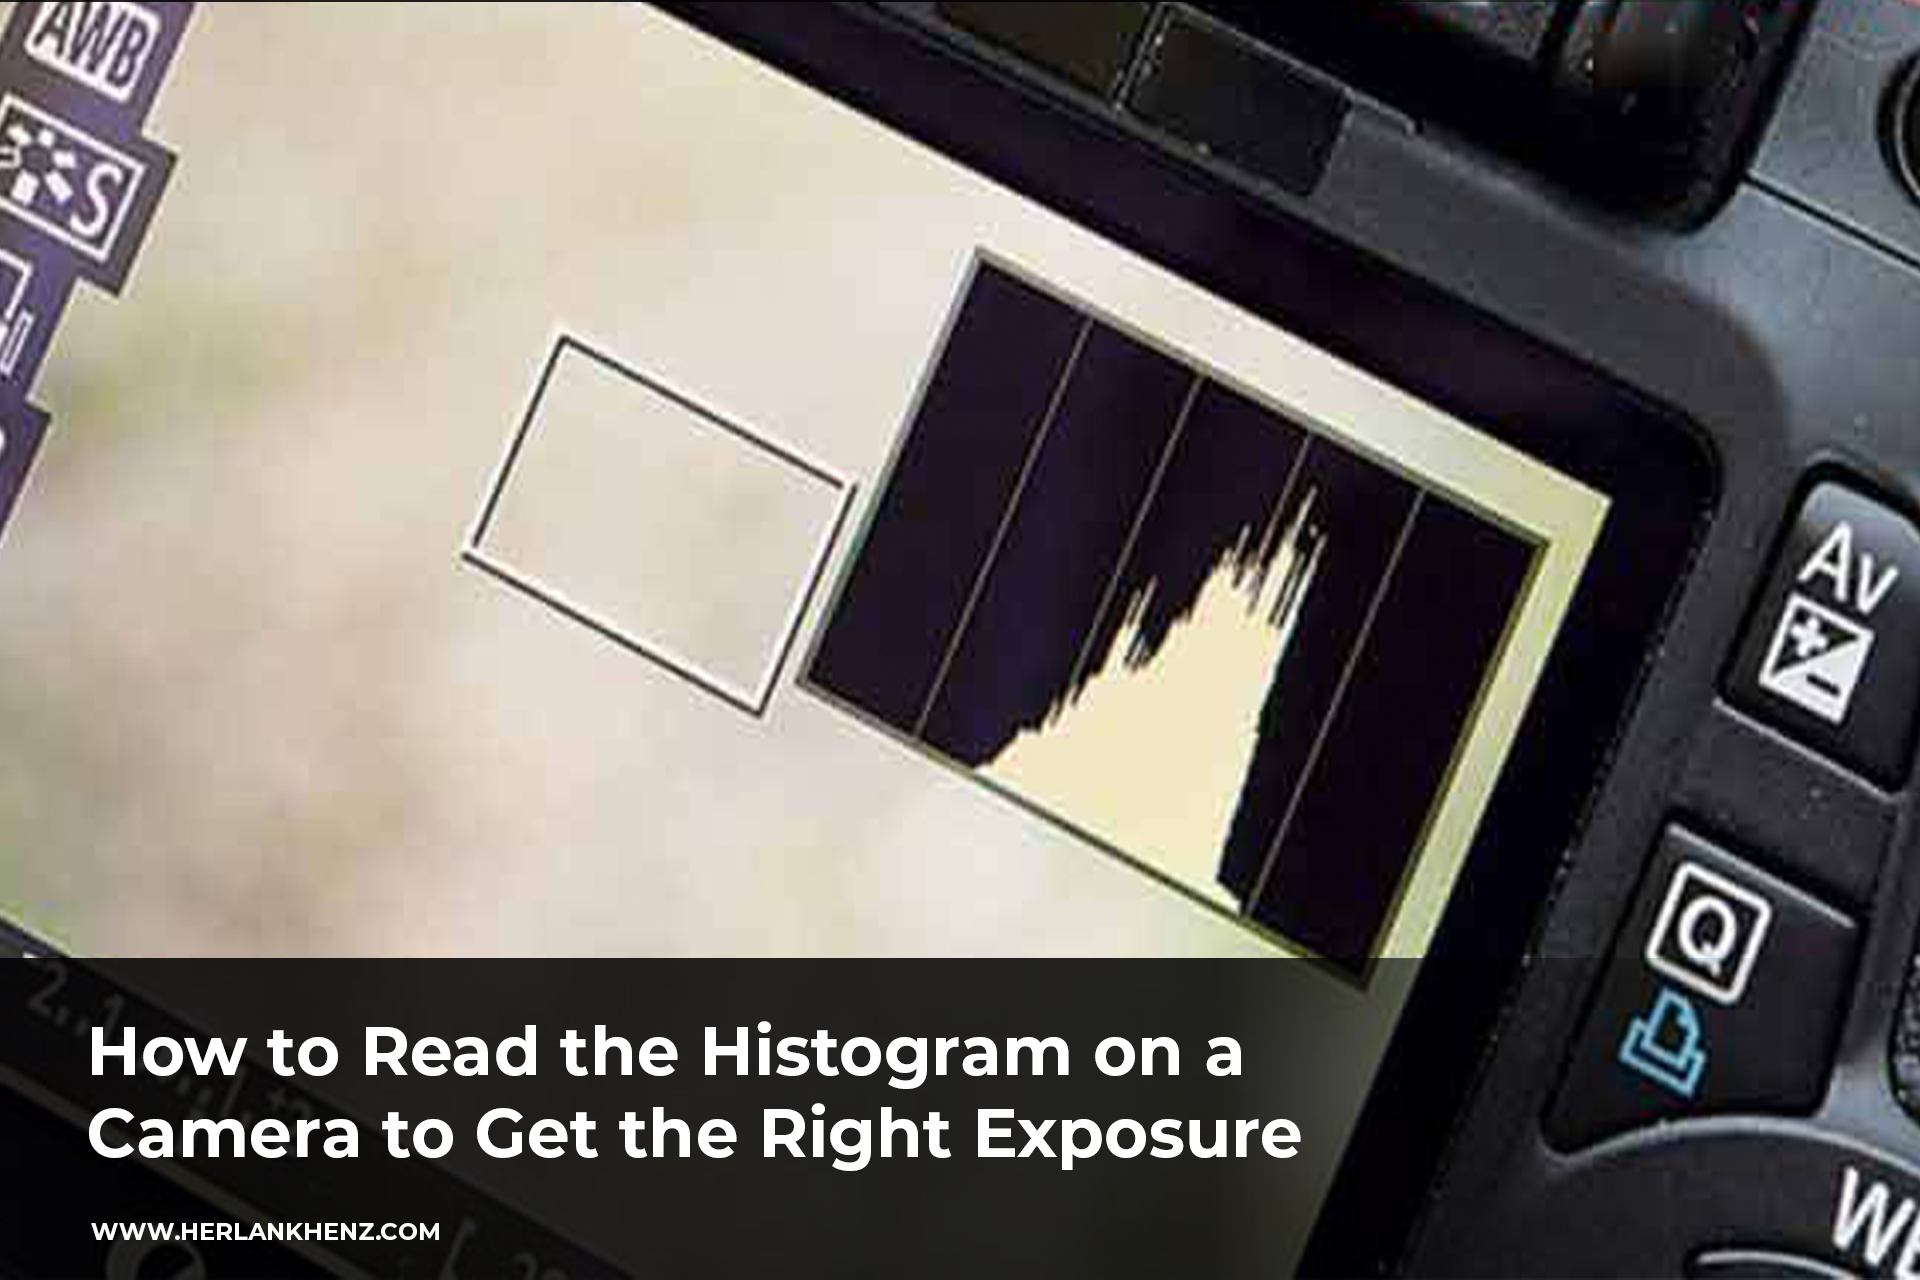
1. Camera LCD Screen
Most modern digital cameras are equipped with an LCD screen that allows you to view the image you just took. Next to the image, you can also see its histogram. This LCD screen is very useful when you want to check the histogram directly after taking a photo. You can see whether an image tends to be overexposed or underexposed and take corrective action if necessary before taking the next image.
2. Electronic Viewfinder (EVF)
EVF is a device found on some mirrorless and bridge cameras. This is an electronic version of the optical viewfinder usually used on DSLR cameras. Some EVFs can display a histogram directly in the viewfinder, allowing you to check exposure when looking through the camera lens.
3. Camera Software
Digital cameras are often equipped with various modes and settings that allow you to display a histogram when viewing the image you just took on the camera screen. You can enable this mode in your camera settings to make lighting monitoring easier.
4. Photo Editing Software
Histograms are also an integral part of photo editing software such as Adobe Lightroom, Adobe Photoshop and most other photo editing software. After importing your photos into this software, you can view the histogram in greater and more detail. This allows you to edit exposure, contrast, and brightness levels with great precision. You can even perform exposure correction and restore lost highlights or shadows based on histogram information.
5. Mobile App
For those who use smartphones for photography, there are many phone camera apps that also display what a histogram is. This can help mobile photographers monitor lighting when taking photos, although it may be smaller than on a digital camera or photo editing software.
6. Digital Camera Connected to Computer
When connecting your digital camera to a computer via USB cable or wirelessly, some photo management applications allow you to view the photo histogram larger on the computer screen. This allows for more detailed evaluation and precision in photo editing and sorting.
7. Histogram in Live View Mode
Some cameras also have the option to display a histogram in real-time on the screen when you use Live View mode. This is especially useful when you're shooting in situations that require quick adjustments, such as macro or night photography.
Advanced Histogram Techniques
In addition to basic uses, there are several advanced histogram techniques in photography that can help you achieve more creative and precise results in lighting. These are some useful techniques to master:
1. Histogram Balancing
Histogram balancing is a technique for achieving a balanced distribution of shadows, mids, and highlights in your images. This is especially important when you want to avoid images that are too contrasty. You can use lighting techniques such as fill flash or shooting with a neutral gradient filter to flatten the histogram.
2. Histogram for HDR (High Dynamic Range)
The HDR technique involves combining several different exposures of a single scene to overcome high contrast. You can use the histogram to guide you in taking the right exposure for each of your HDR photos. Make sure that you have one exposure for the highlights, one for the middle, and one for the shadows. Then, in editing, you can combine them to create images with a wide dynamic range.
3. Histogram During Shooting with Studio Lights
When you work with studio lighting, a histogram can help you ensure that your lighting is consistent and balanced. You can monitor the histogram in Live View mode during shooting and adjust exposure when necessary to achieve the desired results.
4. Histogram for Night Shooting
In night photography, the histogram will help you avoid underexposure which is common due to low lighting. You may need to use techniques such as using a tripod and long exposure to take photos that fill the histogram well.
5. Histogram in High Speed Shooting
When you're shooting very fast-moving subjects, like sports, a histogram can help you set shutter speed and exposure appropriately. This allows you to capture subjects with consistent lighting even when moving quickly.
6. Histogram During Limited Lighting
In situations where you have lighting limitations, such as concert or stage photography, a histogram can help you get the right exposure. You may need to adjust your camera quickly according to lighting changes during the show.
7. Histogram for Macro Shooting
In macro shooting, details are very important. The histogram will help you ensure that you have good enough detail in the highlights and shadows on your small subject. Lighting arrangements such as using spotlights or diffusers can help you achieve good results.
Conclusion
Histograms help you avoid common mistakes, such as extreme overexposure or underexposure, which can harm the quality of your images. This is a visual guide that allows you to control exposure with a high degree of precision, both when shooting and when making edits. You can monitor lighting in real-time, preserving important details, and exploring unique creative effects in lighting.
Never ignore what a histogram is when you are out with your camera or while doing photo editing. It's a tool that helps you become a more skilled and advanced photographer. With practice, understanding, and proper use, histograms will help you create stunning images and better express your creativity in the world of photography.